

How to inspect virtual network activity
Learn how to trace transactions, inspect API traffic, and diagnose localnet node or indexer problems
Trace transactions, inspect API traffic, and diagnose readiness problems in the selected environment.
Prerequisites
- A virtual environment. Status and diagnostics remain available when it is stopped or fails to start.
Inspect execution and readiness
Send requests and deployments through the Studio connection settings to capture them in API calls and the automatic contract registry.
- Open Explorer, find an account, and inspect balances, code, storage, and transaction history. Browse blocks, jettons, and non-fungible tokens (NFTs); save useful addresses in Favorites.
- Open a transaction to inspect phases, fees, messages, and state changes. Retrace it for execution details when matching source artifacts are available.
- Use Contracts for registered addresses, source artifacts, and application binary interfaces (ABIs). Add existing addresses manually when their deployment did not pass through Studio. Review the Sources and ABI catalogs for available metadata.
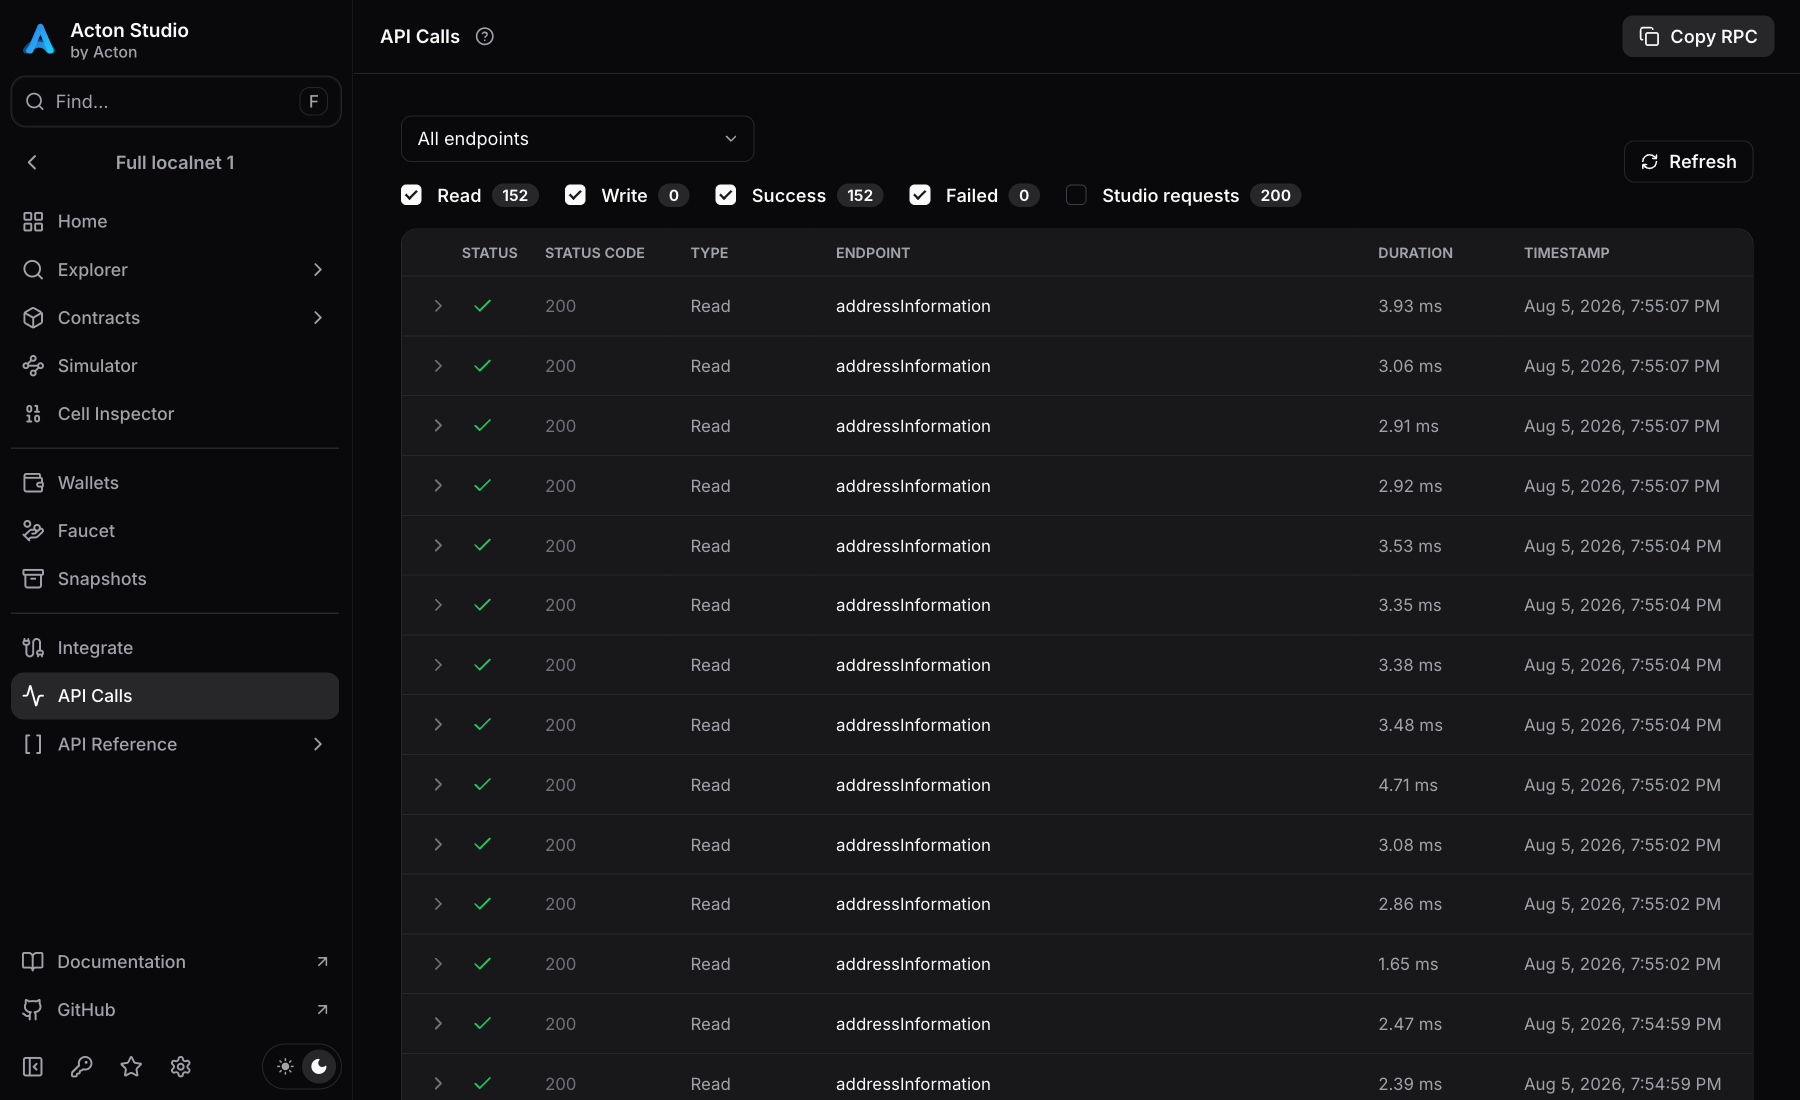
- Open API calls to inspect request/response data, timing, and errors. Enable the Studio requests filter to include calls made by the UI itself.
- For localnet, open Network → Health for API readiness, indexer lag, and service health. Inspect Nodes, Validators, and Stats for synchronization, elections, and queues. On startup failure, expand Diagnostic details for the runtime error. The nodes page includes Collector diagnostics for observer failures.
- The simulator has no equivalent validator or service log dashboard.
The common Studio tools provide message previews, cell inspection, address conversion, and interactive API requests.
acton simulator status --port 5411 --json
curl --fail http://127.0.0.1:5411/api/v2/getMasterchainInfo
Inspect the foreground terminal for process diagnostics. A successful status exit code can report running: false; inspect the JSON field. For pending messages, check manual mining and the virtual clock.
acton localnet status dev --json
acton localnet logs dev --tail 200
The log command prints a bounded tail of the network operation log once and exits. It does not follow a live stream. Use the reported Dashboard URL for node health and elections. For a pending operation, replace <OPERATION_ID> with its ID from status:
acton localnet operation '<OPERATION_ID>' --network dev --waitAn accepted operation is not a completed operation. Inspect its terminal status and error before using the result.
Verify the diagnosis
| Symptom | Check |
|---|---|
| No simulator transactions | Manually mine pending blocks; check the client's selected endpoint. |
| The localnet produces blocks but reads fail | Wait for APIs and indexer readiness, then inspect service health and logs. |
| A deployment or request is missing in Studio | Direct provider/runtime URLs bypass Studio's proxy. |
| Source is unavailable | Build the project version matching the deployed code hash. |
HTTP 401 from simulator APIs | Supply the token from --require-auth through the UI key control or ACTON_LOCALNET_AUTH_TOKEN. |
| Old API calls disappear | The bounded request log is temporary and clears on Studio restart. |
Preserve relevant errors and exclude credentials when reporting failures. Use Studio snapshot controls to recover previous states.
Last updated on