

Acton Studio
Develop contracts with local tests, virtual environments, and public networks in one browser workspace
Acton Studio is the browser workspace for Acton development. Keep it running to rebuild project artifacts, inspect local tests, manage virtual environments, and interact with testnet and mainnet. All with the same consistent UI.
Start with local emulator tests, continue development on a simulator network, validate deployments on testnet, then deploy to mainnet. Explorer, wallets, contracts, and debugging tools follow the same layout across virtual environments and public networks.
Get started
With Acton 1.2 or later installed, run this from the directory containing Acton.toml:
acton studioStudio opens the local workspace in the browser. The overview shows the project, connection status, recent tests, and running environments.
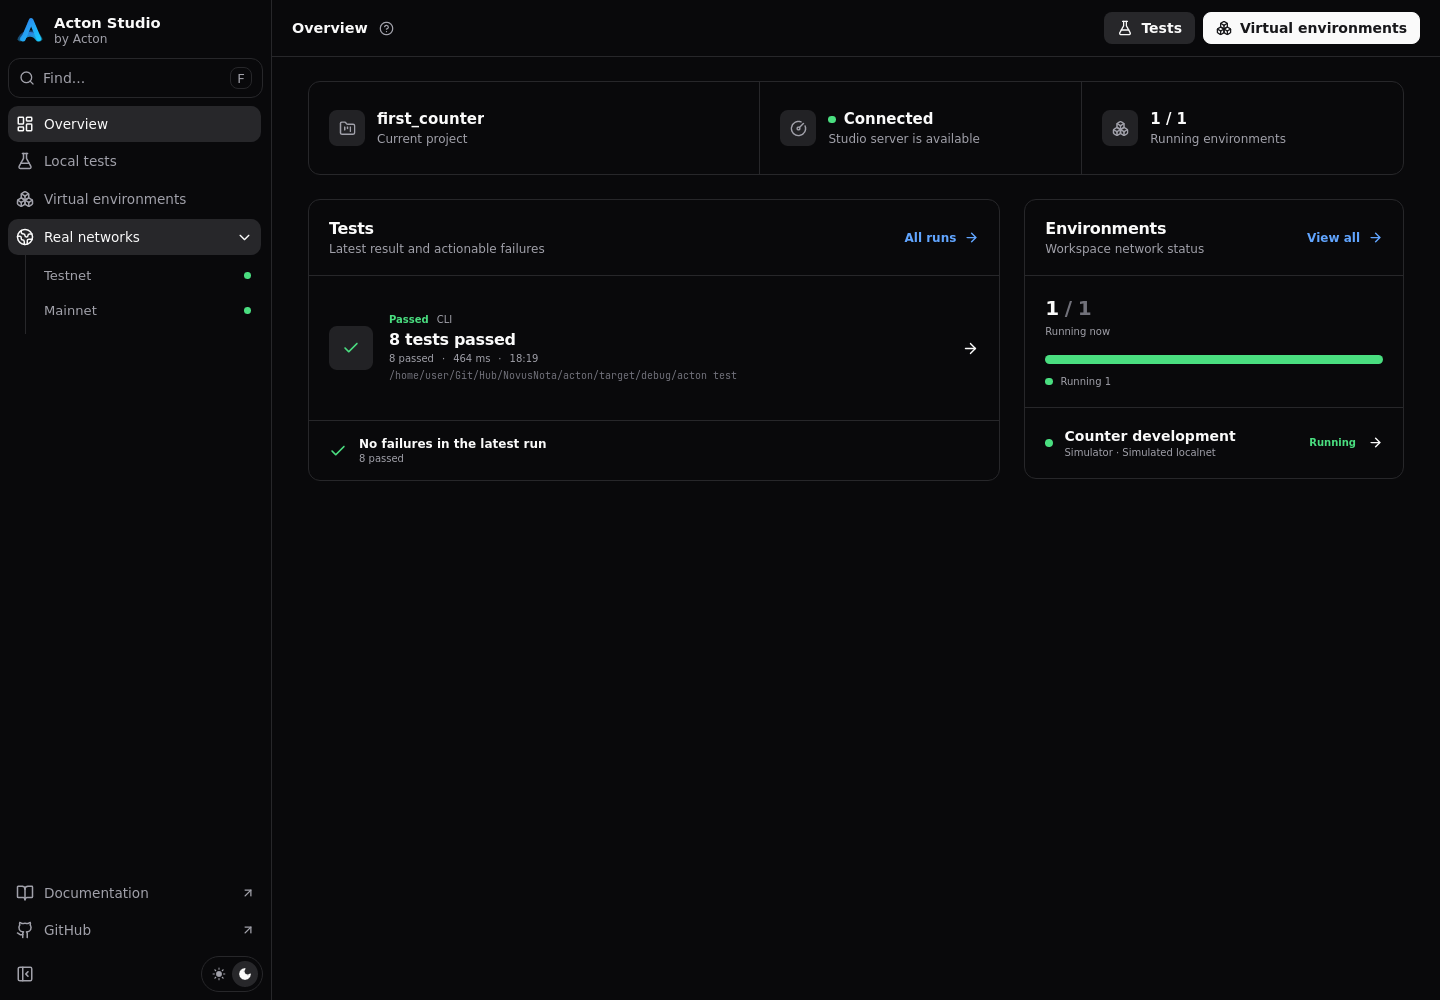
Outside a project, Studio can explore public networks and create simulator networks without project wallets. An Acton.toml project is required for local tests, project builds, and configured wallets.
When Studio finds no contracts in Acton.toml, it suggests adding one on stdout.
Studio listens on loopback only — press Ctrl+C to stop it.
To open the printed Studio URL manually, pass --no-open:
acton studio --no-openIf the default port is occupied, pass --port <PORT>, replacing <PORT> with an available port number. Only one Studio instance can run per project — use different ports for different projects.
acton studio --port <PORT>The workspace history and managed environment data are kept in .studio/ placed within the root of the git repository, nearest Acton.toml, or the current directory if neither are found.
Daemon
Studio watches project Tolk sources and Acton.toml. Changes trigger an Acton build and refresh the source and ABI artifacts used to decode contracts and trace execution. Build diagnostics appear in the terminal running Studio.
Run tests from the browser or CLI after editing. Run deployment scripts when ready to update the selected network.
Switching networks in the Studio does not discard the previous state — contracts and balances stay on the network where they were created.
Dashboard
The Studio is split between three main areas:
The key information from each is gathered together in the Overview page.
Each network workspace keeps the tools in the same order. When in a virtual environment or a real network, use Find… in the upper-left corner to locate tools, addresses, transactions, blocks, and known contracts.
Select the environment name to return to the main navigation.
Local tests
Studio integrates all Test UI capabilities, including result and transaction inspector plus coverage and gas profiling into Local tests, alongside project-wide test run history.
These tests execute in the local emulator rather than in a virtual environment:
- Select Run tests, keep Save traces enabled, and leave the filters empty to run the entire project test suite.
- Narrow later runs by path, test name, or include/exclude patterns.
- Enable Fail fast to stop at the first failure. A run started in Studio can also be cancelled from its details page.
With Studio already running, tests started in another terminal report to the same history:
acton testThe run table shows results, duration, start time, and whether Studio or the CLI started the run.
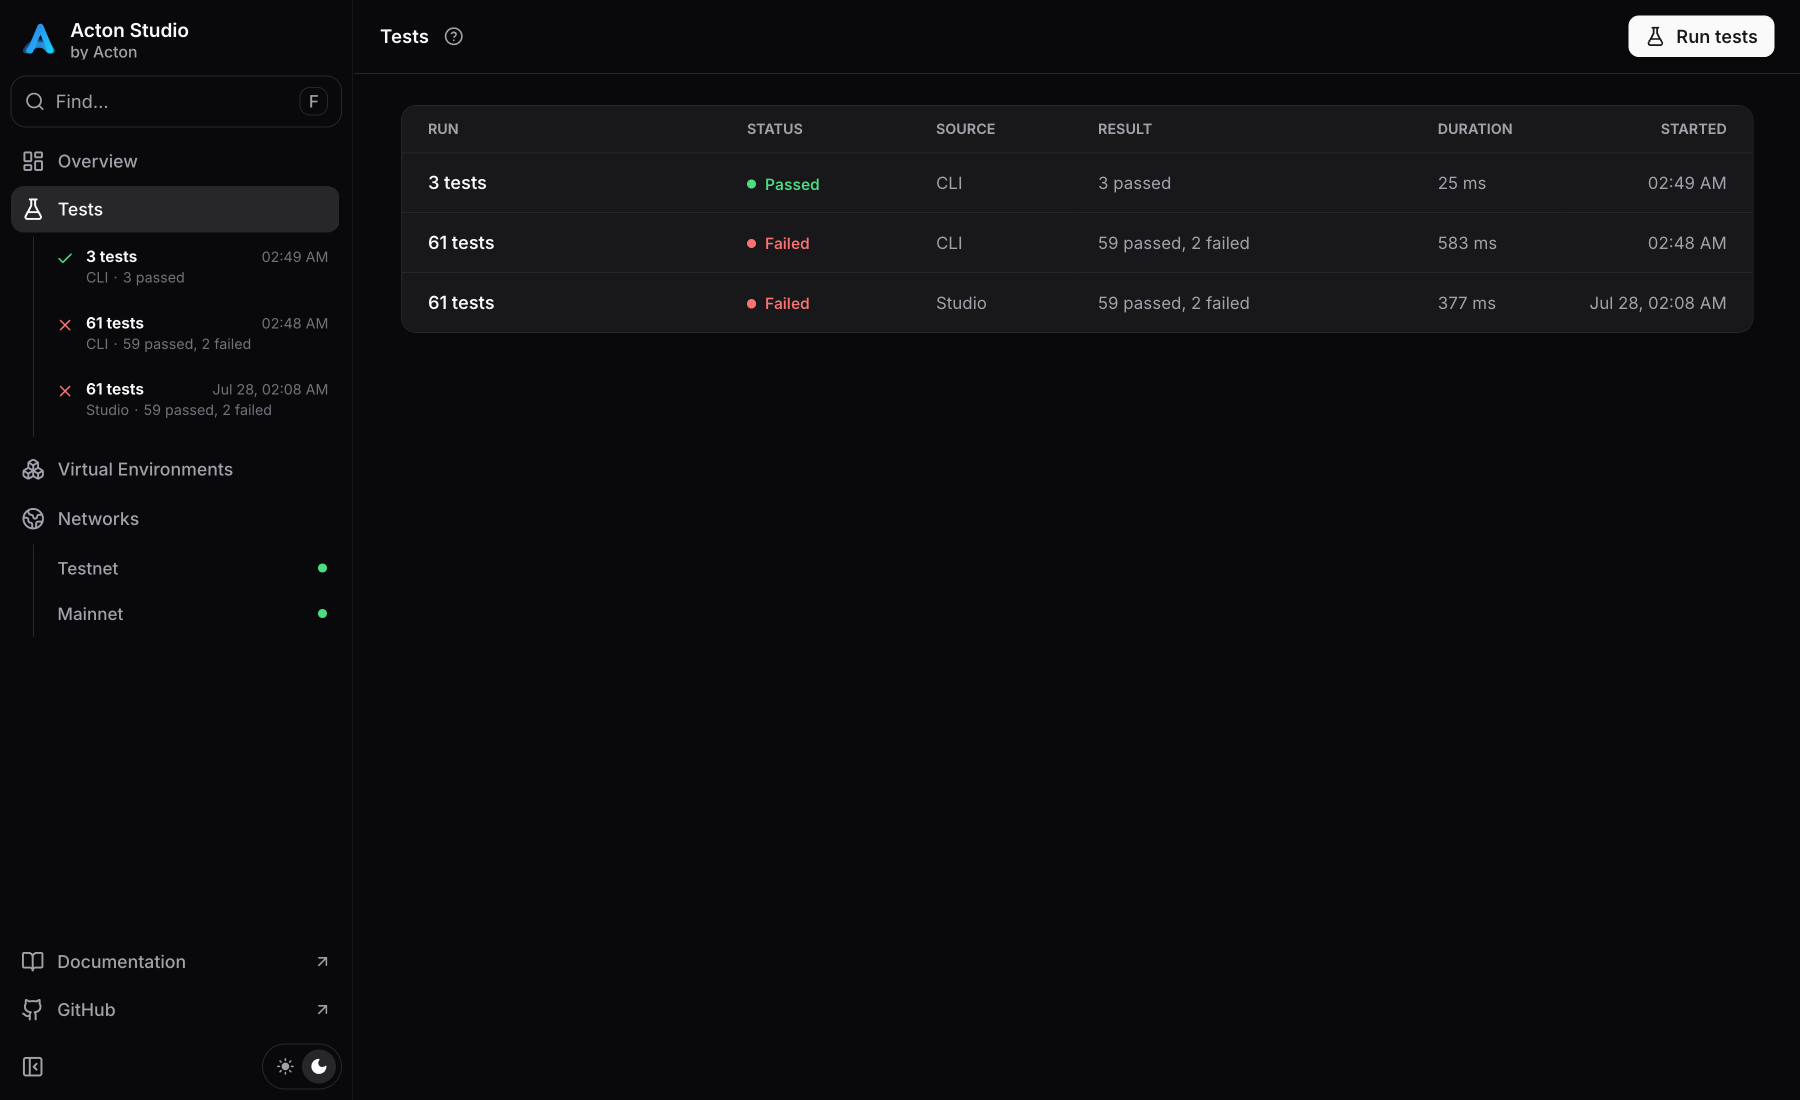
Open a run, select a test, and inspect:
- Info: failures, matcher messages, source locations, and fees.
- Transactions: message chains, compute/action/storage/bounce phases, exit codes, and state changes.
- Logs: executor and VM output.
Runner output captures compilation and process failures for Studio-started runs. CLI runs keep stdout and stderr in their terminal.
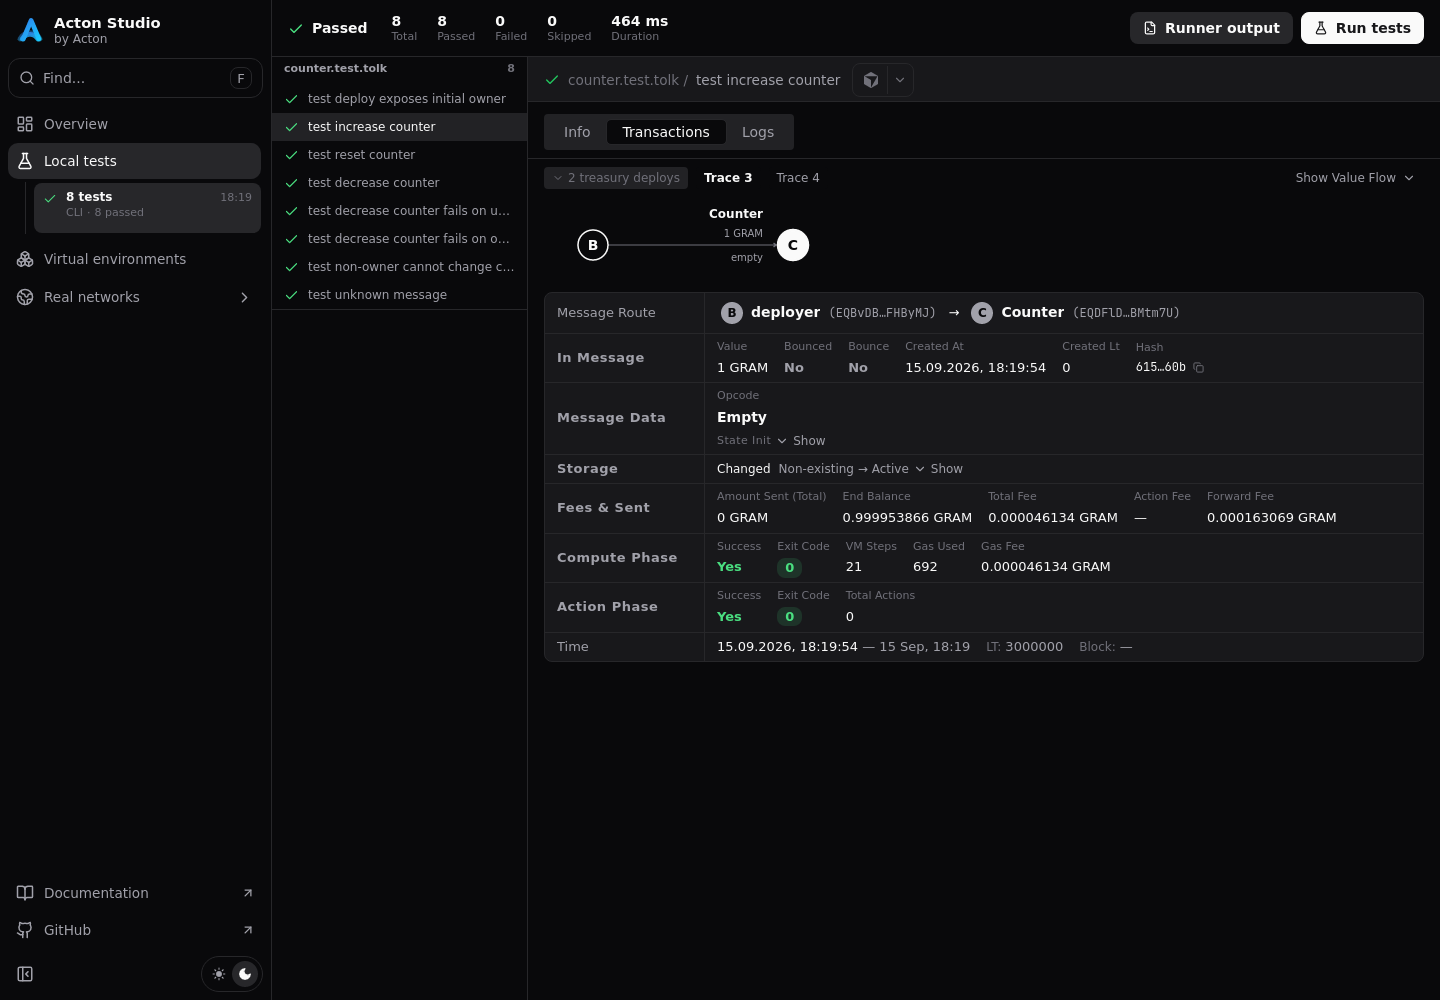
See the Test UI reference for exact transaction panels, trace controls, and source navigation.
Completed runs survive Studio restarts. To disable reporting for one run, pass --no-studio-reporting:
acton test --no-studio-reportingTo override the project default, set studio-reporting = false in Acton.toml under [test] table.
Virtual environments
Isolated local TON networks with persistent presets and unified UI.
Overview
Compare development networks and find task guides.
Network creation
Set up a network and select optional startup wallets.
Client connections
Configure scripts, applications, and wallets.
Save and restore snapshots
Keep checkpoints for repeatable scenarios.
Simulator
Explore simulator controls and API compatibility.
Localnet
Find Docker requirements and node management guides.
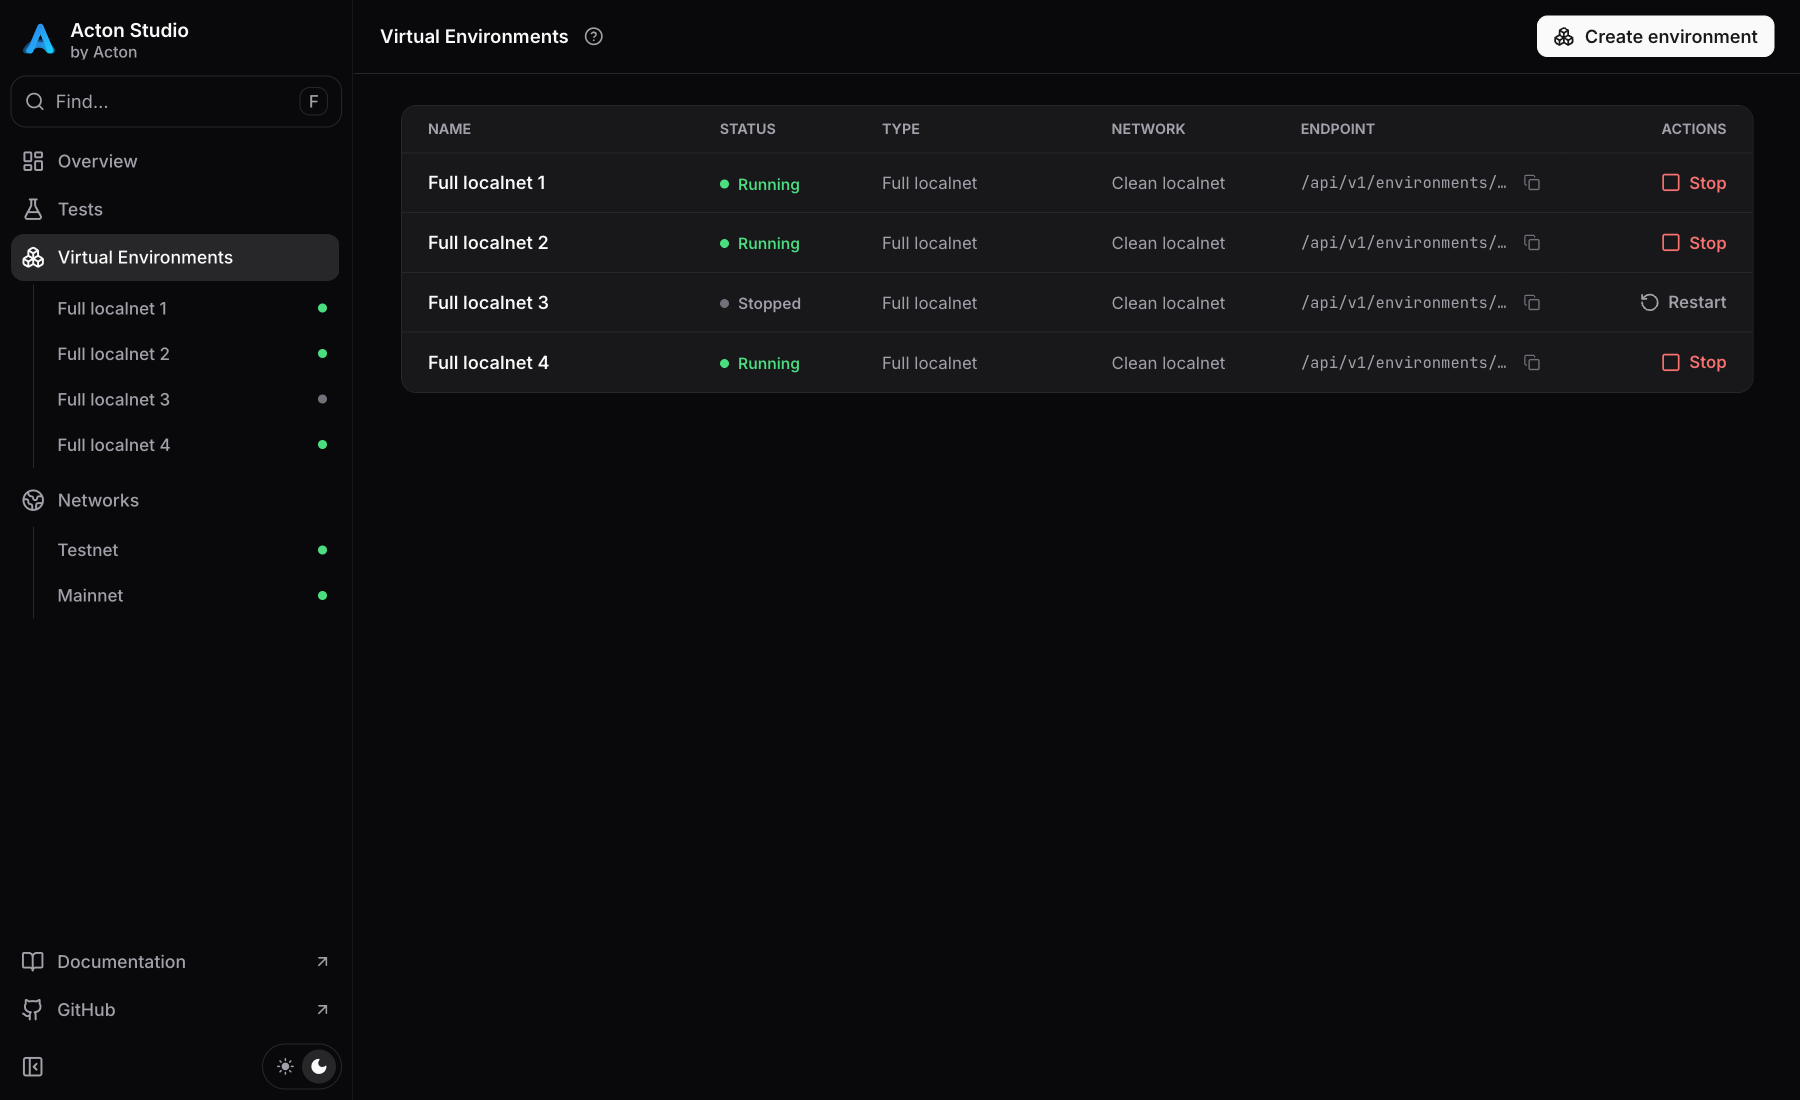
Real networks
Open Real networks → Testnet or Mainnet to inspect accounts, transactions, tokens, and NFTs, run get-methods, emulate messages, and interact through wallets.
Public networks have most of the same workspace tools as virtual environments, except for their lifecycle, administration, and mining controls. Testnet dashboard retains the Faucet page that works by utilizing the real faucet provided by Acton.
Acton CLI commands route default testnet and mainnet requests automatically through the running Studio instance, making submissions visible alongside project source and ABI artifacts.
Custom RPC endpoints and external applications need the generated Integrate settings to send requests through Studio. Deployment scripts use the network selected by --net — changing the browser's selected network does not change a CLI command's destination.
Public-network writes submit transactions from the selected wallet. Validate on a simulator network and testnet before mainnet, then check the network, recipient, and amount. Transactions on mainnet spend real funds and cannot be rolled back.
Common tools
Each network workspace keeps the tools in the same order. When in a virtual environment or a real network, use Find… in the upper-left corner to locate tools, addresses, transactions, blocks, and known contracts.
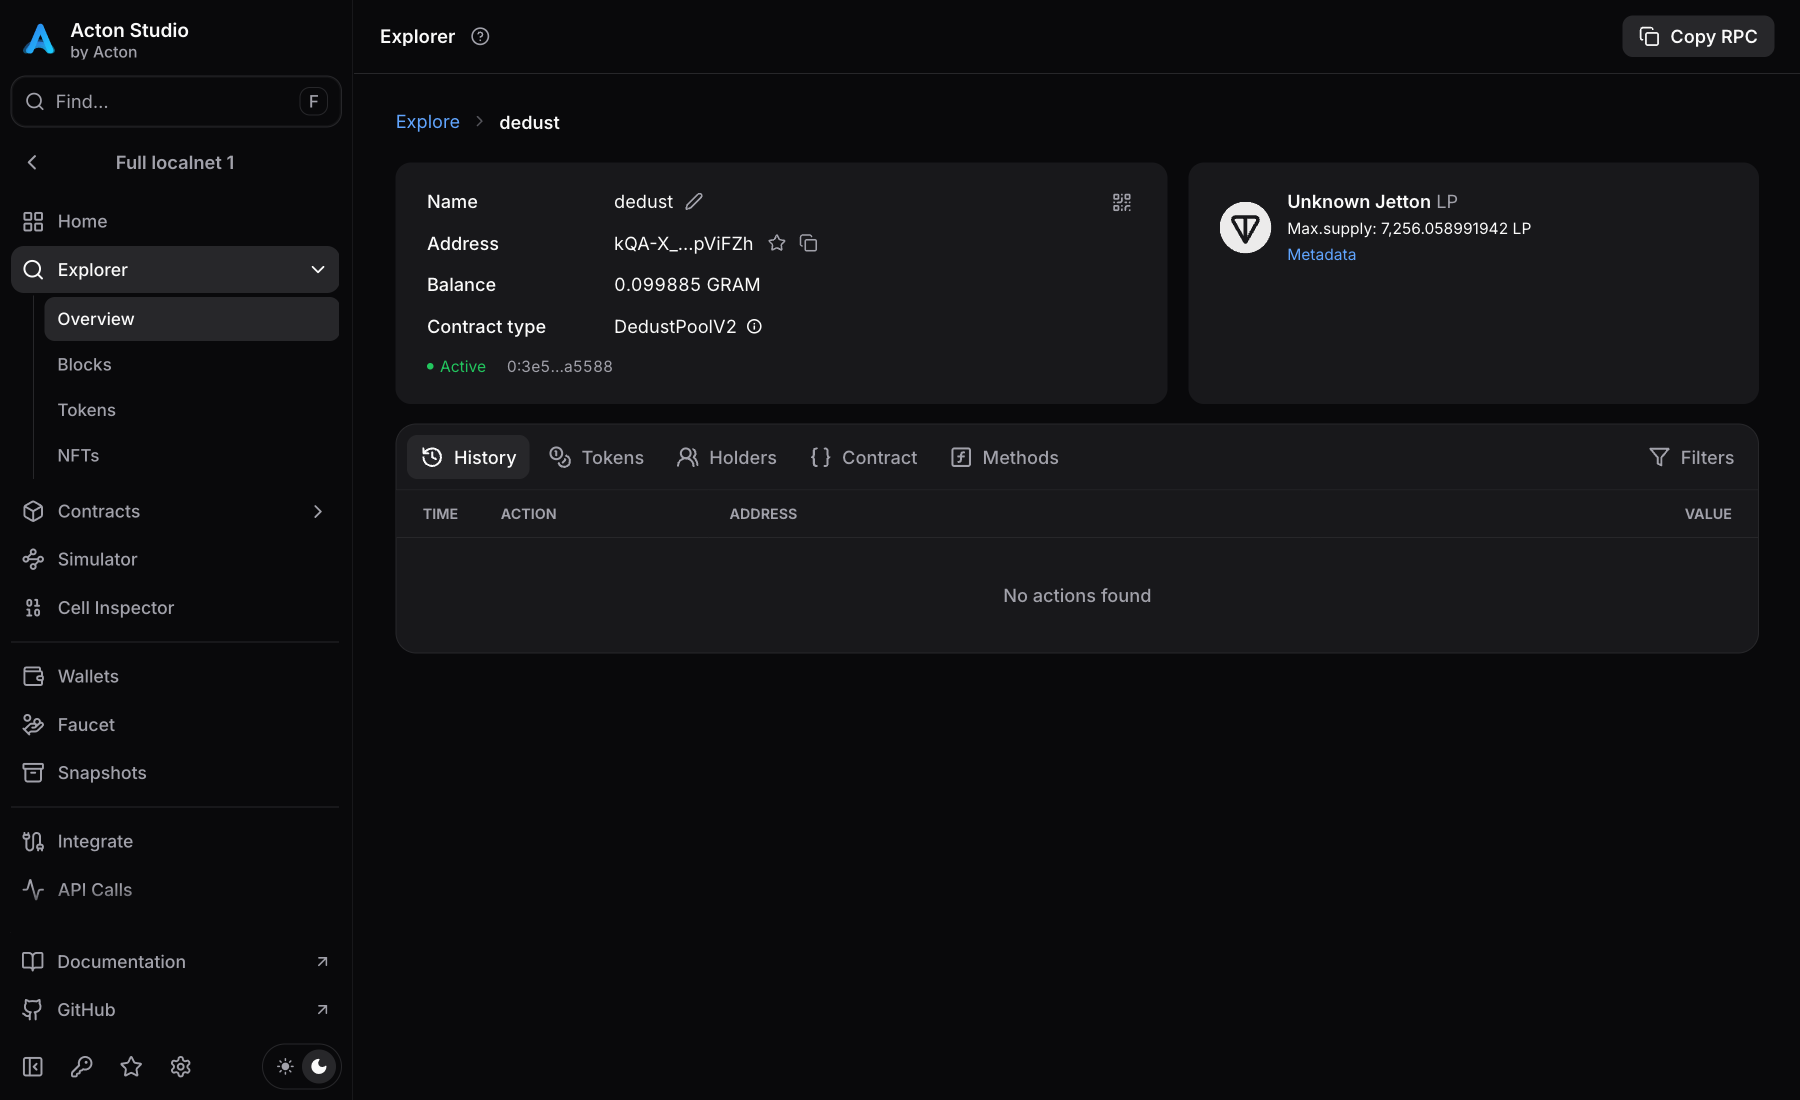
Explorer
Browse accounts, blocks, tokens, NFTs, and blockchain configuration; inspect elections on public networks. Run ABI-backed get-methods and inspect code, storage, transaction phases, fees, messages, and state changes. Retrace transactions for execution details; save accounts in Favorites.
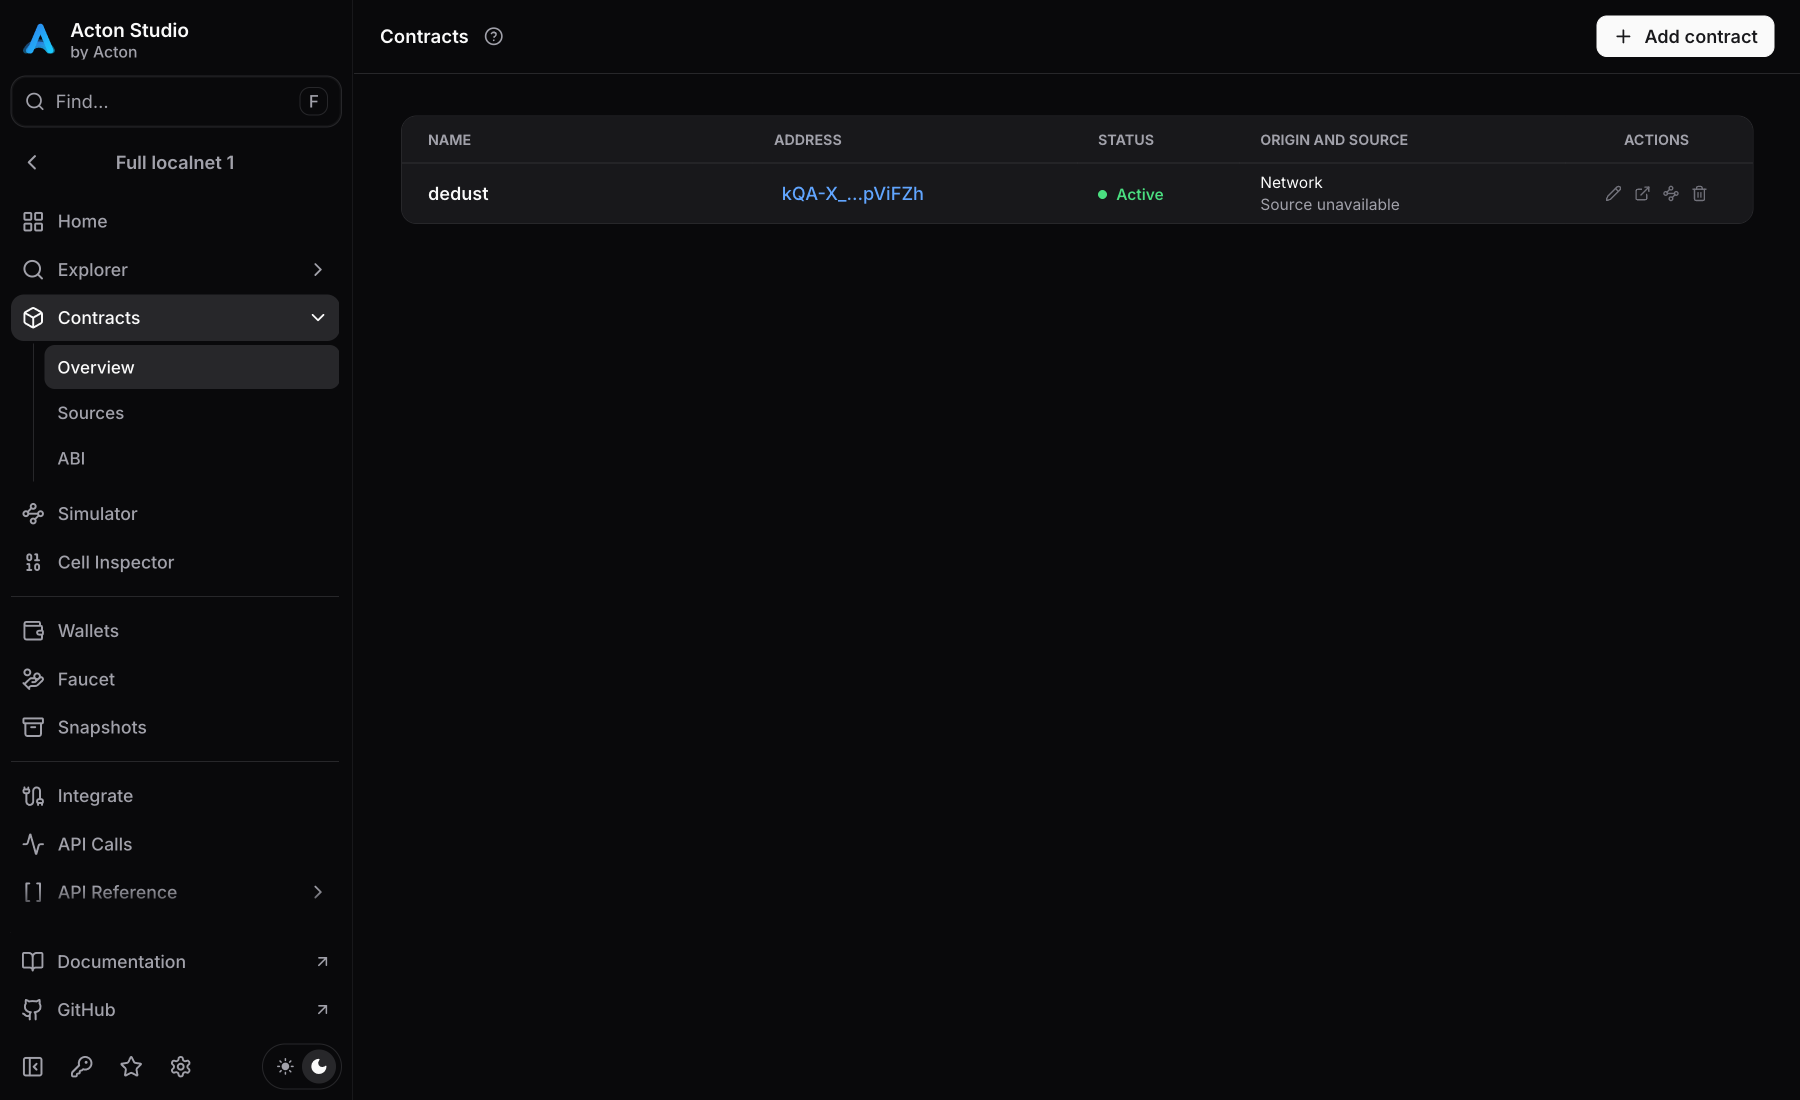
Contracts
Name and track addresses, inspect source artifacts and ABI, and open contracts in Explorer or message simulation.
-
Successful deployments using Studio endpoints enter Contracts automatically. Existing addresses outside of the project need to be added manually.
-
Registration alone does not supply source or ABI: source matching uses the deployed code hash — the catalog ABI can decode a contract independently. Removing a registry entry leaves the on-chain account intact.
Transaction emulator
Build a typed message or paste a raw BoC, set temporary account/time overrides, and emulate against the selected network. Message simulation works within a network workspace and does not require a simulator network.
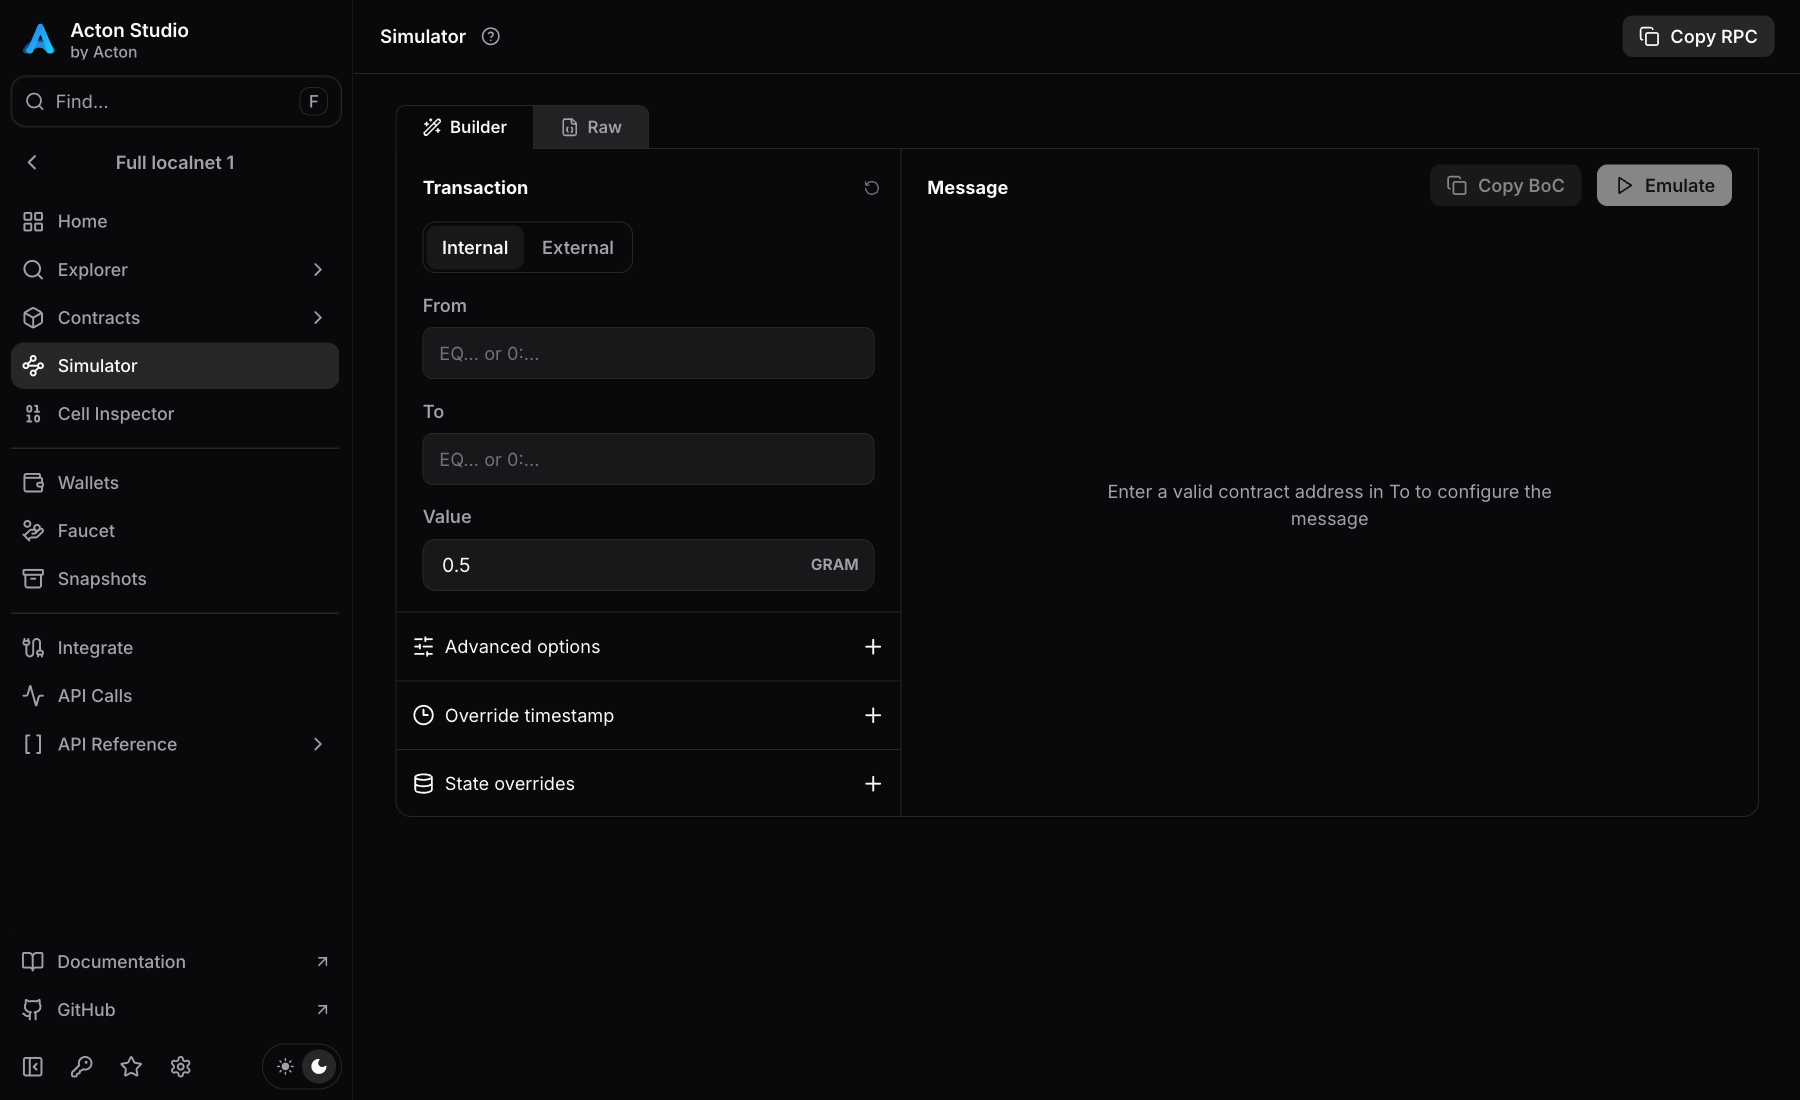
Transaction emulator does not change the network state. Its result depends on the selected state and present overrides. Later emulations can differ from the earlier ones.
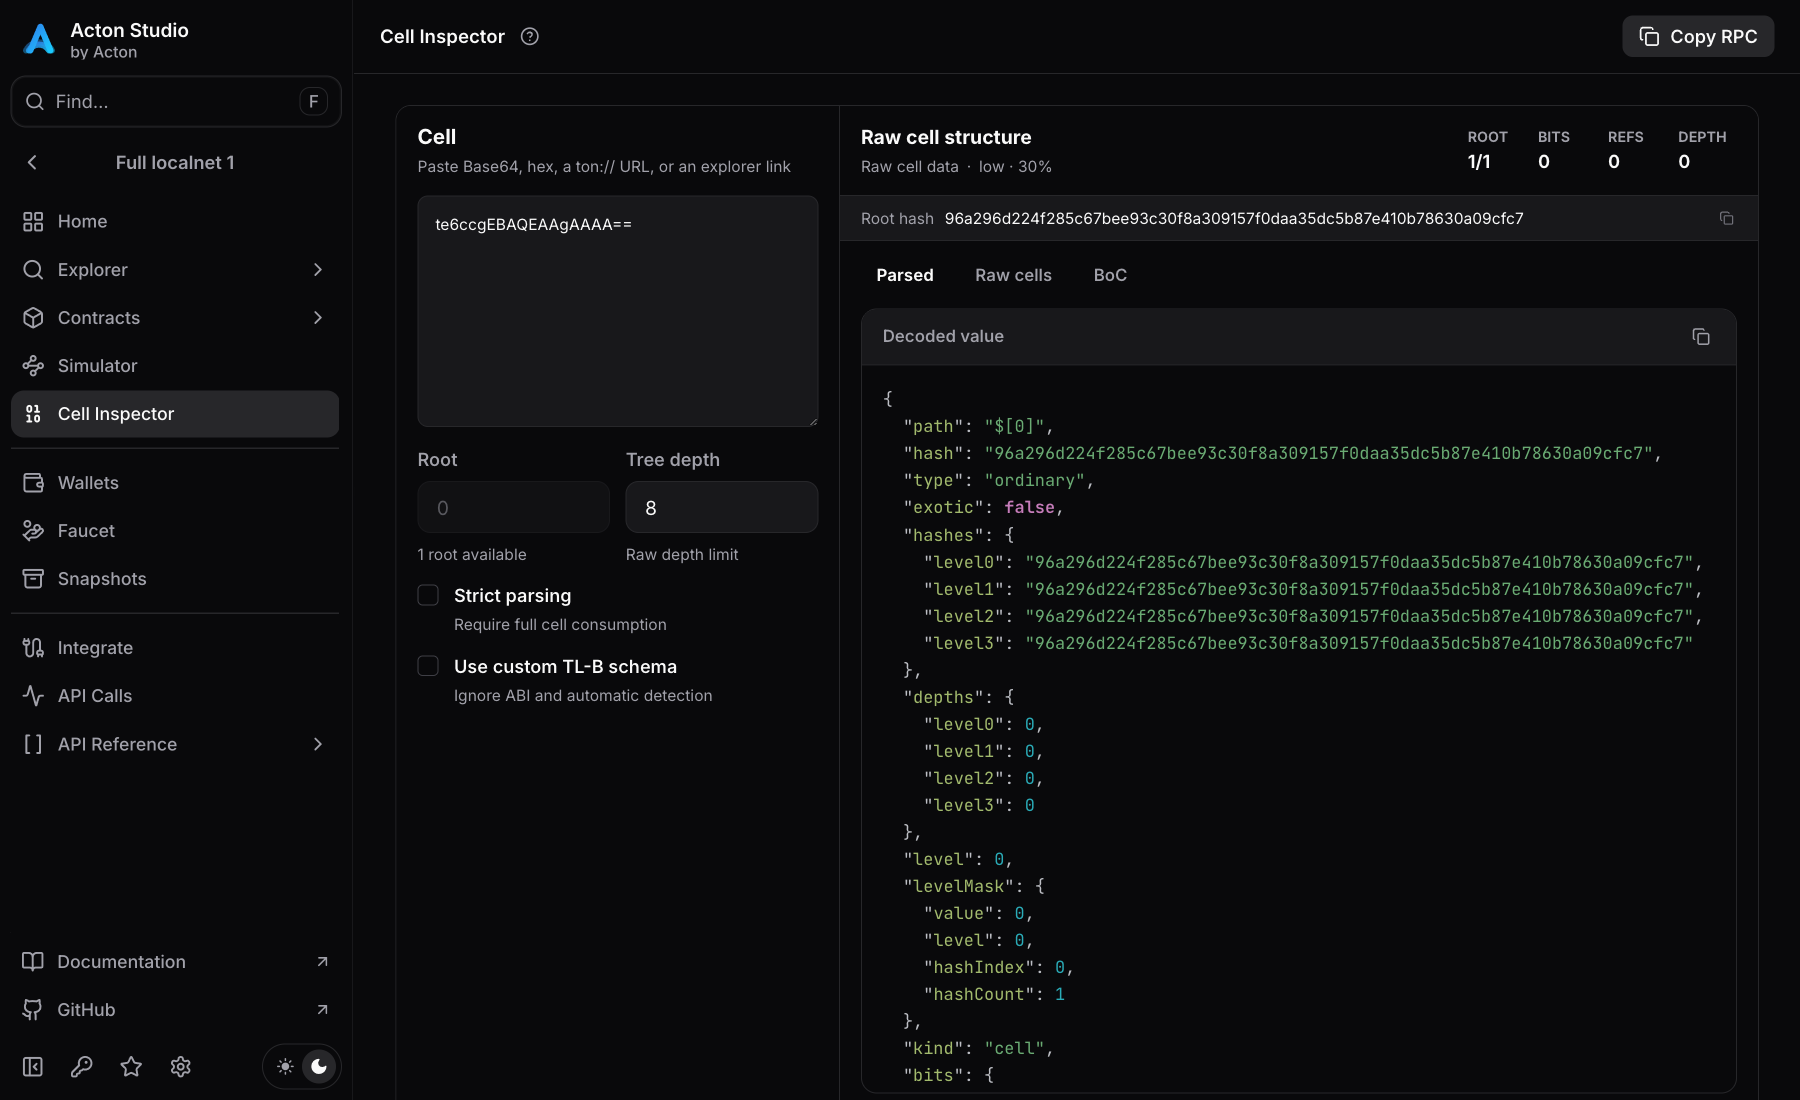
Cell inspector
Decode BoC data, navigate roots, bits, and references, apply a TL-B schema, or inspect code disassembly.
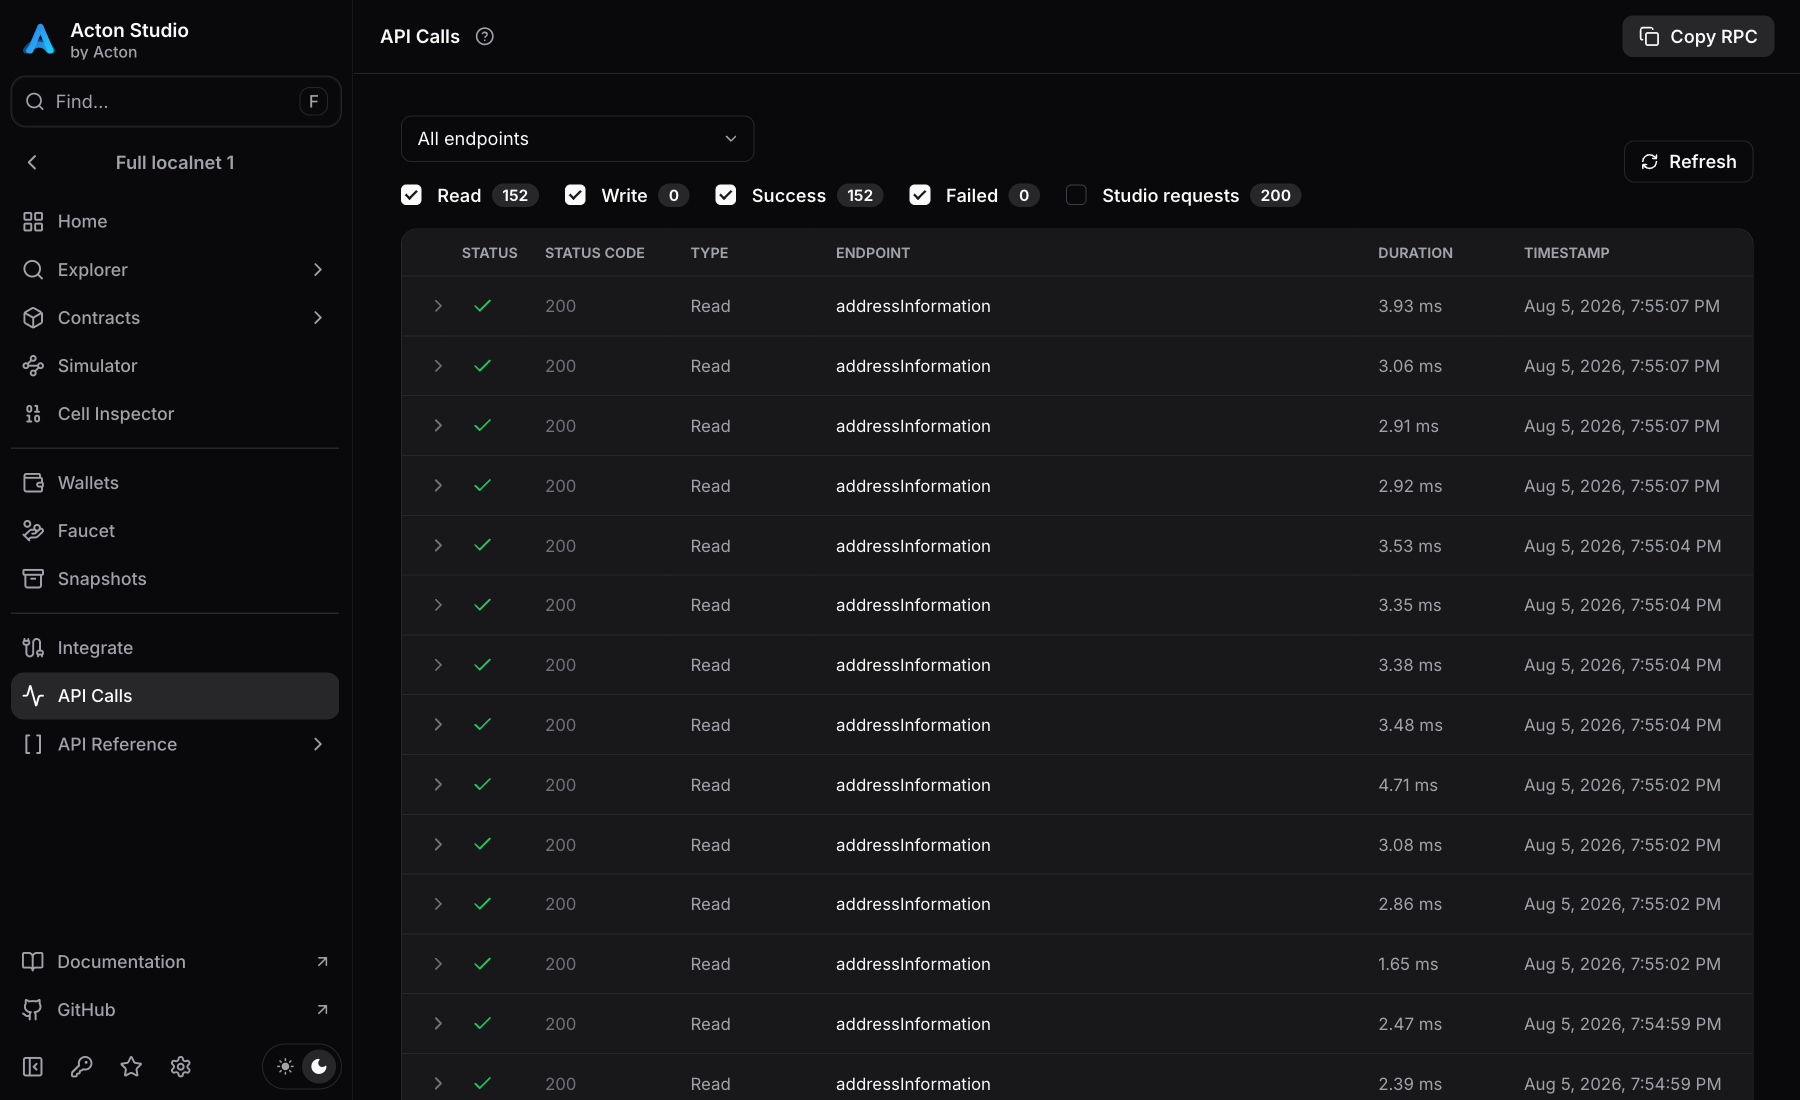
API calls
Filter requests by endpoint, read/write, status, or Studio origin. Inspect request and response data and timing.
Additional tools
| Tool | Functionality |
|---|---|
| Address converter | Convert raw and friendly address formats and inspect bounceable and testnet-only flags. |
| Wallets | Inspect configured wallet balances, send transactions, or connect a dApp through TON Connect. Mnemonics are not sent to the browser. |
| API reference | Execute supported V2/V3, simulator control, and localnet admin/config operations. |
Troubleshooting
| Symptom | Check |
|---|---|
| Studio does not start | Choose another port and check whether Studio already runs for the same project. |
| A test run is missing | Start Studio before the test, use the same project root, and enable reporting. Earlier terminal-only runs are not imported automatically. |
| Explorer data is stale | Check the selected network and runtime readiness. The localnet APIs and indexers must be ready, not only its TON node. Inspect startup/Docker output if startup fails. |
| A contract or request is missing | Use the generated Studio endpoint. Direct provider requests bypass observation; add existing contracts manually. |
| Source is unavailable | Build the project version matching the deployed code hash. |
| An API request is unauthorized | Enter the environment API token through the sidebar key control; it is separate from wallet credentials. |
| A tool is absent | Its availability depends on the selected network's capabilities and runtime status. |
-
API calls keeps a bounded, temporary log — older entries can be evicted and restarting Studio clears it.
-
Use Studio controls to manage saved state instead of editing
.studio/. -
When reporting a bug, include the Acton version, network type, and relevant errors, excluding credentials. Ensure that there are clear and minimal steps to reproduce the bug.
Next steps
- Write and configure tests for the local emulator.
- Continue development on a simulator network.
- Prepare deployment scripts and configure wallets for network interaction.
Last updated on