TestingTest UI
Quickstart
Step-by-step guide to run Test UI and inspect failed tests, traces, transactions, logs, and gas profiles
The acton test --ui runs the suite, opens the browser UI, and surfaces failed tests, traces, logs, coverage, and gas profiles.
1. Run tests with UI
acton test --uiUseful variants:
# Choose a custom UI port
acton test --ui --ui-port 23456

# Run only selected tests
acton test tests/counter.test.tolk --ui --filter "test deploy"

# Open Test UI with coverage viewer enabled
acton test --coverage --ui

# Open Test UI with gas profile flamegraphs enabled
acton test --gas-profile build/gas.cpuprofile --ui
With both --coverage and --ui, an extra Coverage tab appears next to the regular test results view.
With both --gas-profile and --ui, an extra Profile tab appears. Add --gas-profile-include-tests when you need gas profiles for .test.tolk unit-test get-method execution.
2. Open failed test first
In the left sidebar:
- filter by
Failed - click the failed test
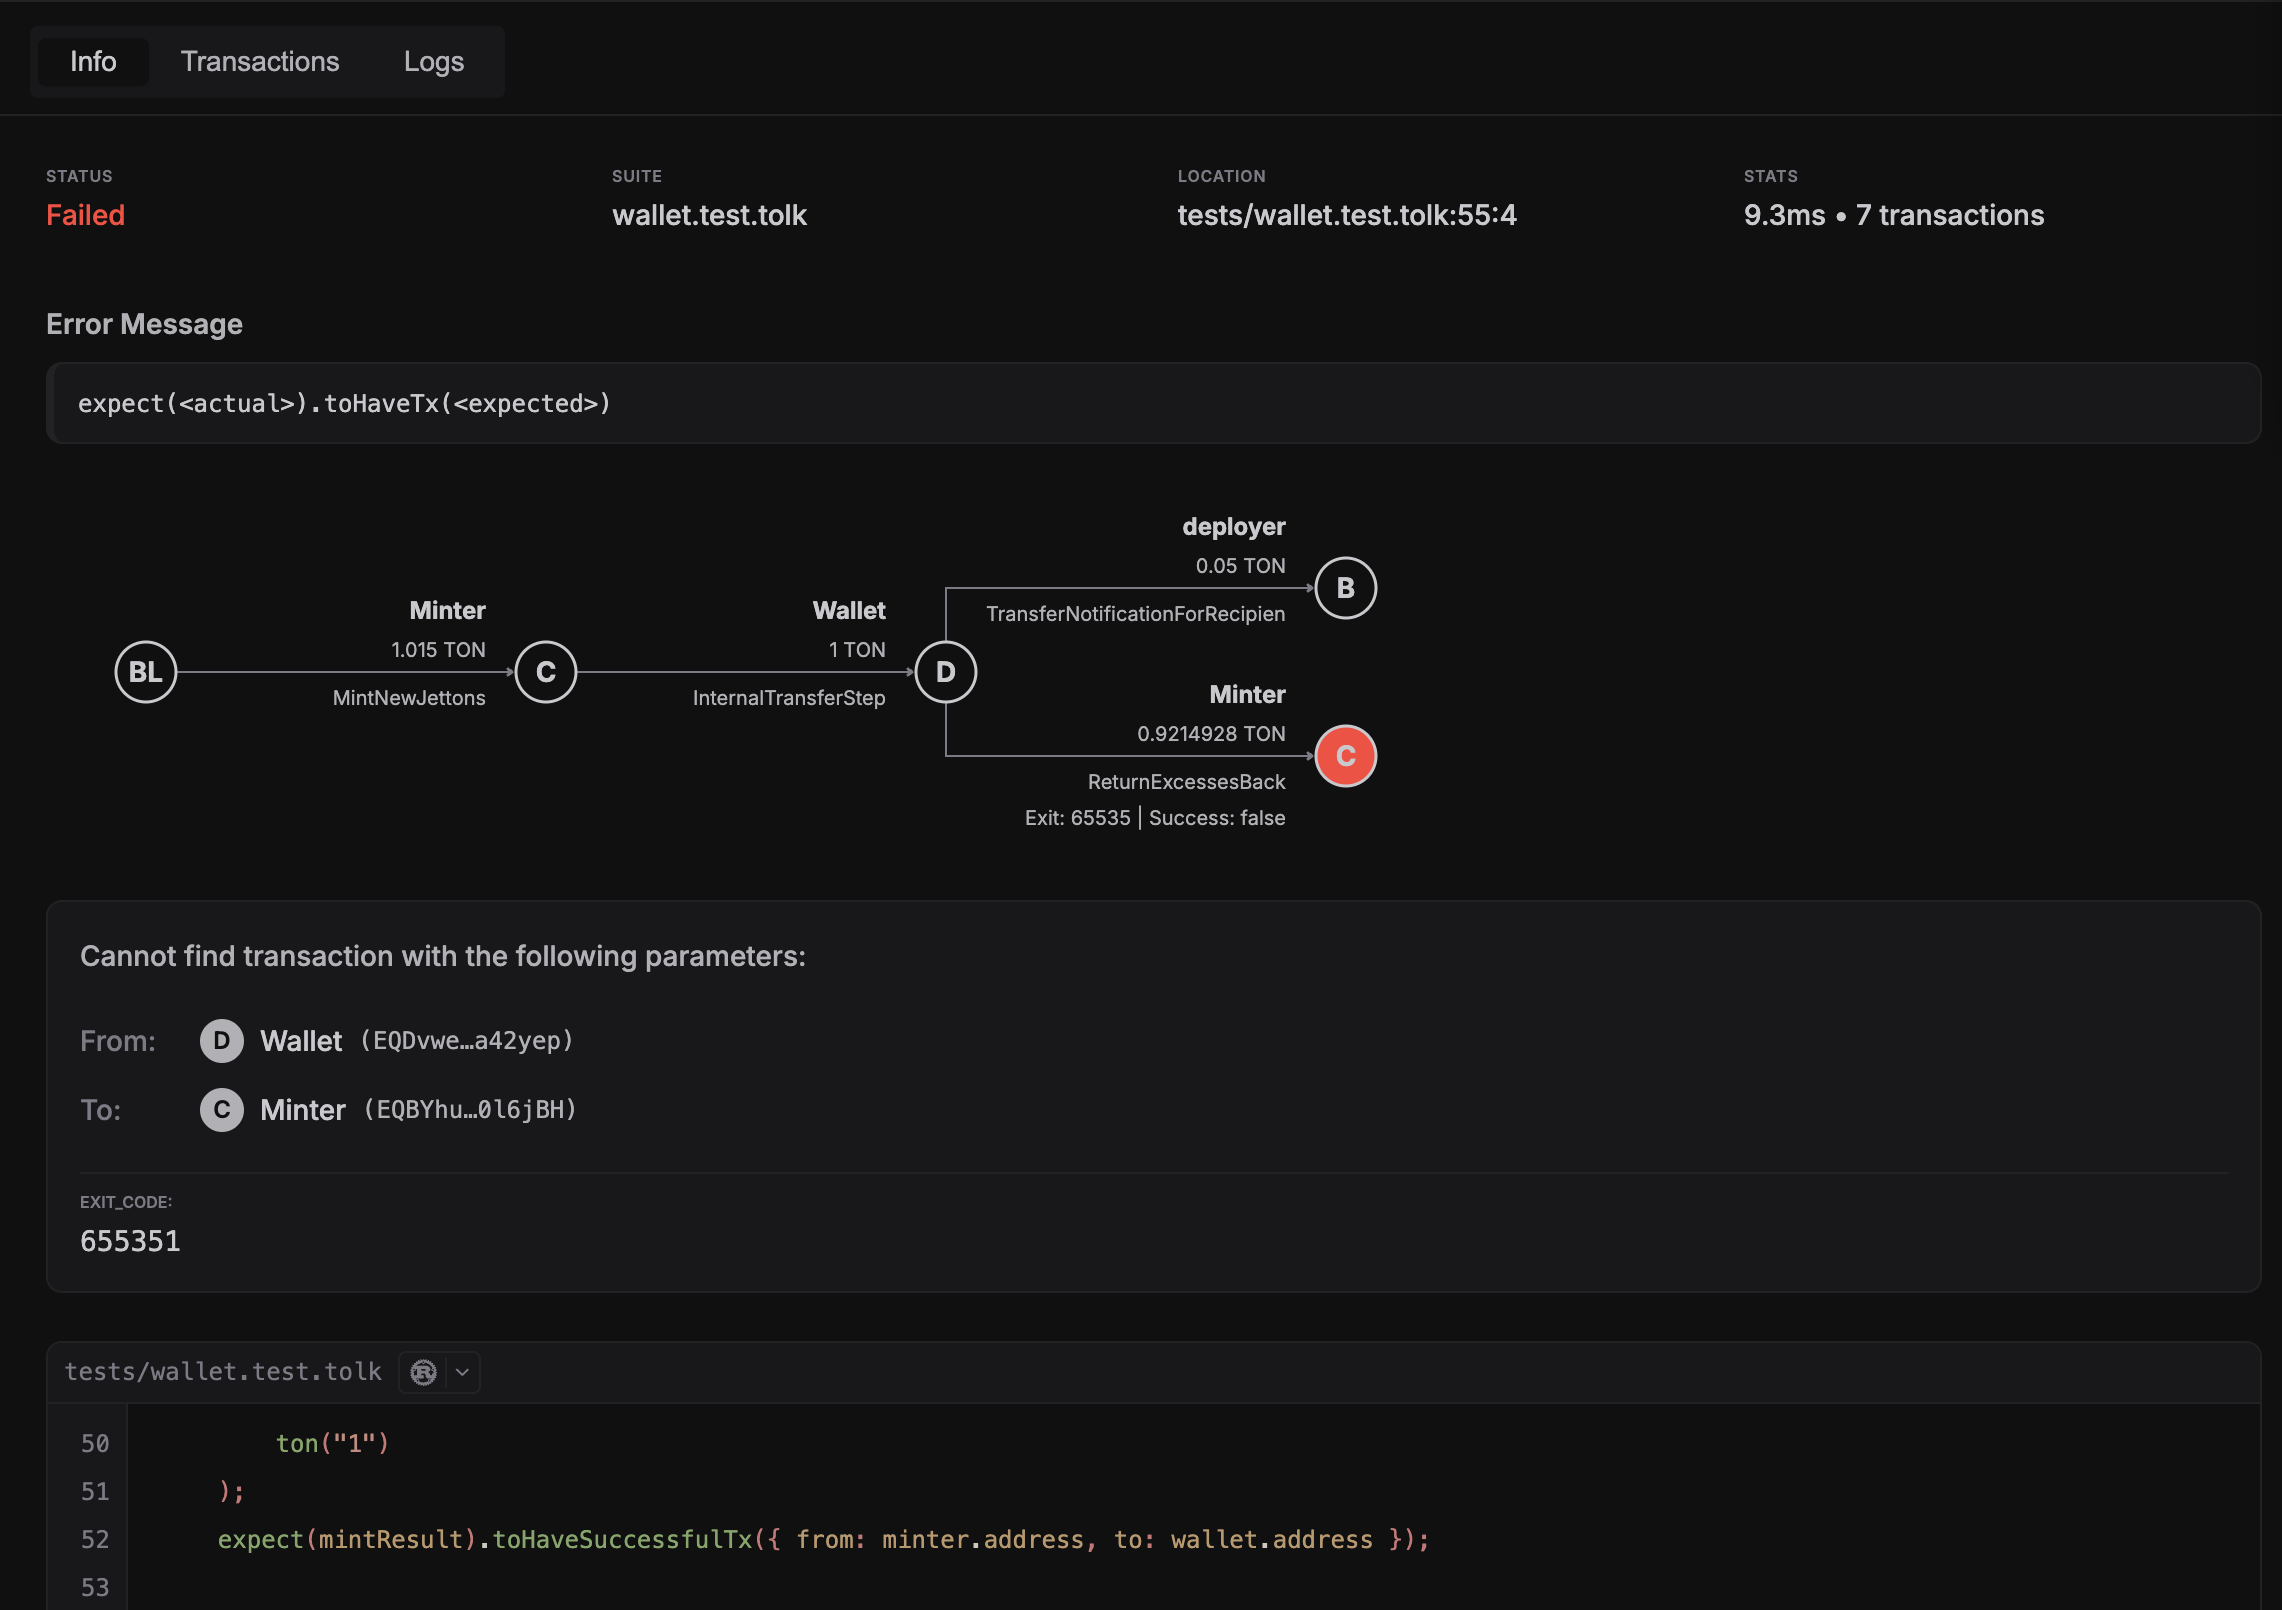
- open
Infotab
In Info tab, check:
- error message and matcher context
- source location (
file:line:column) - fee summary per trace
3. Inspect execution graph
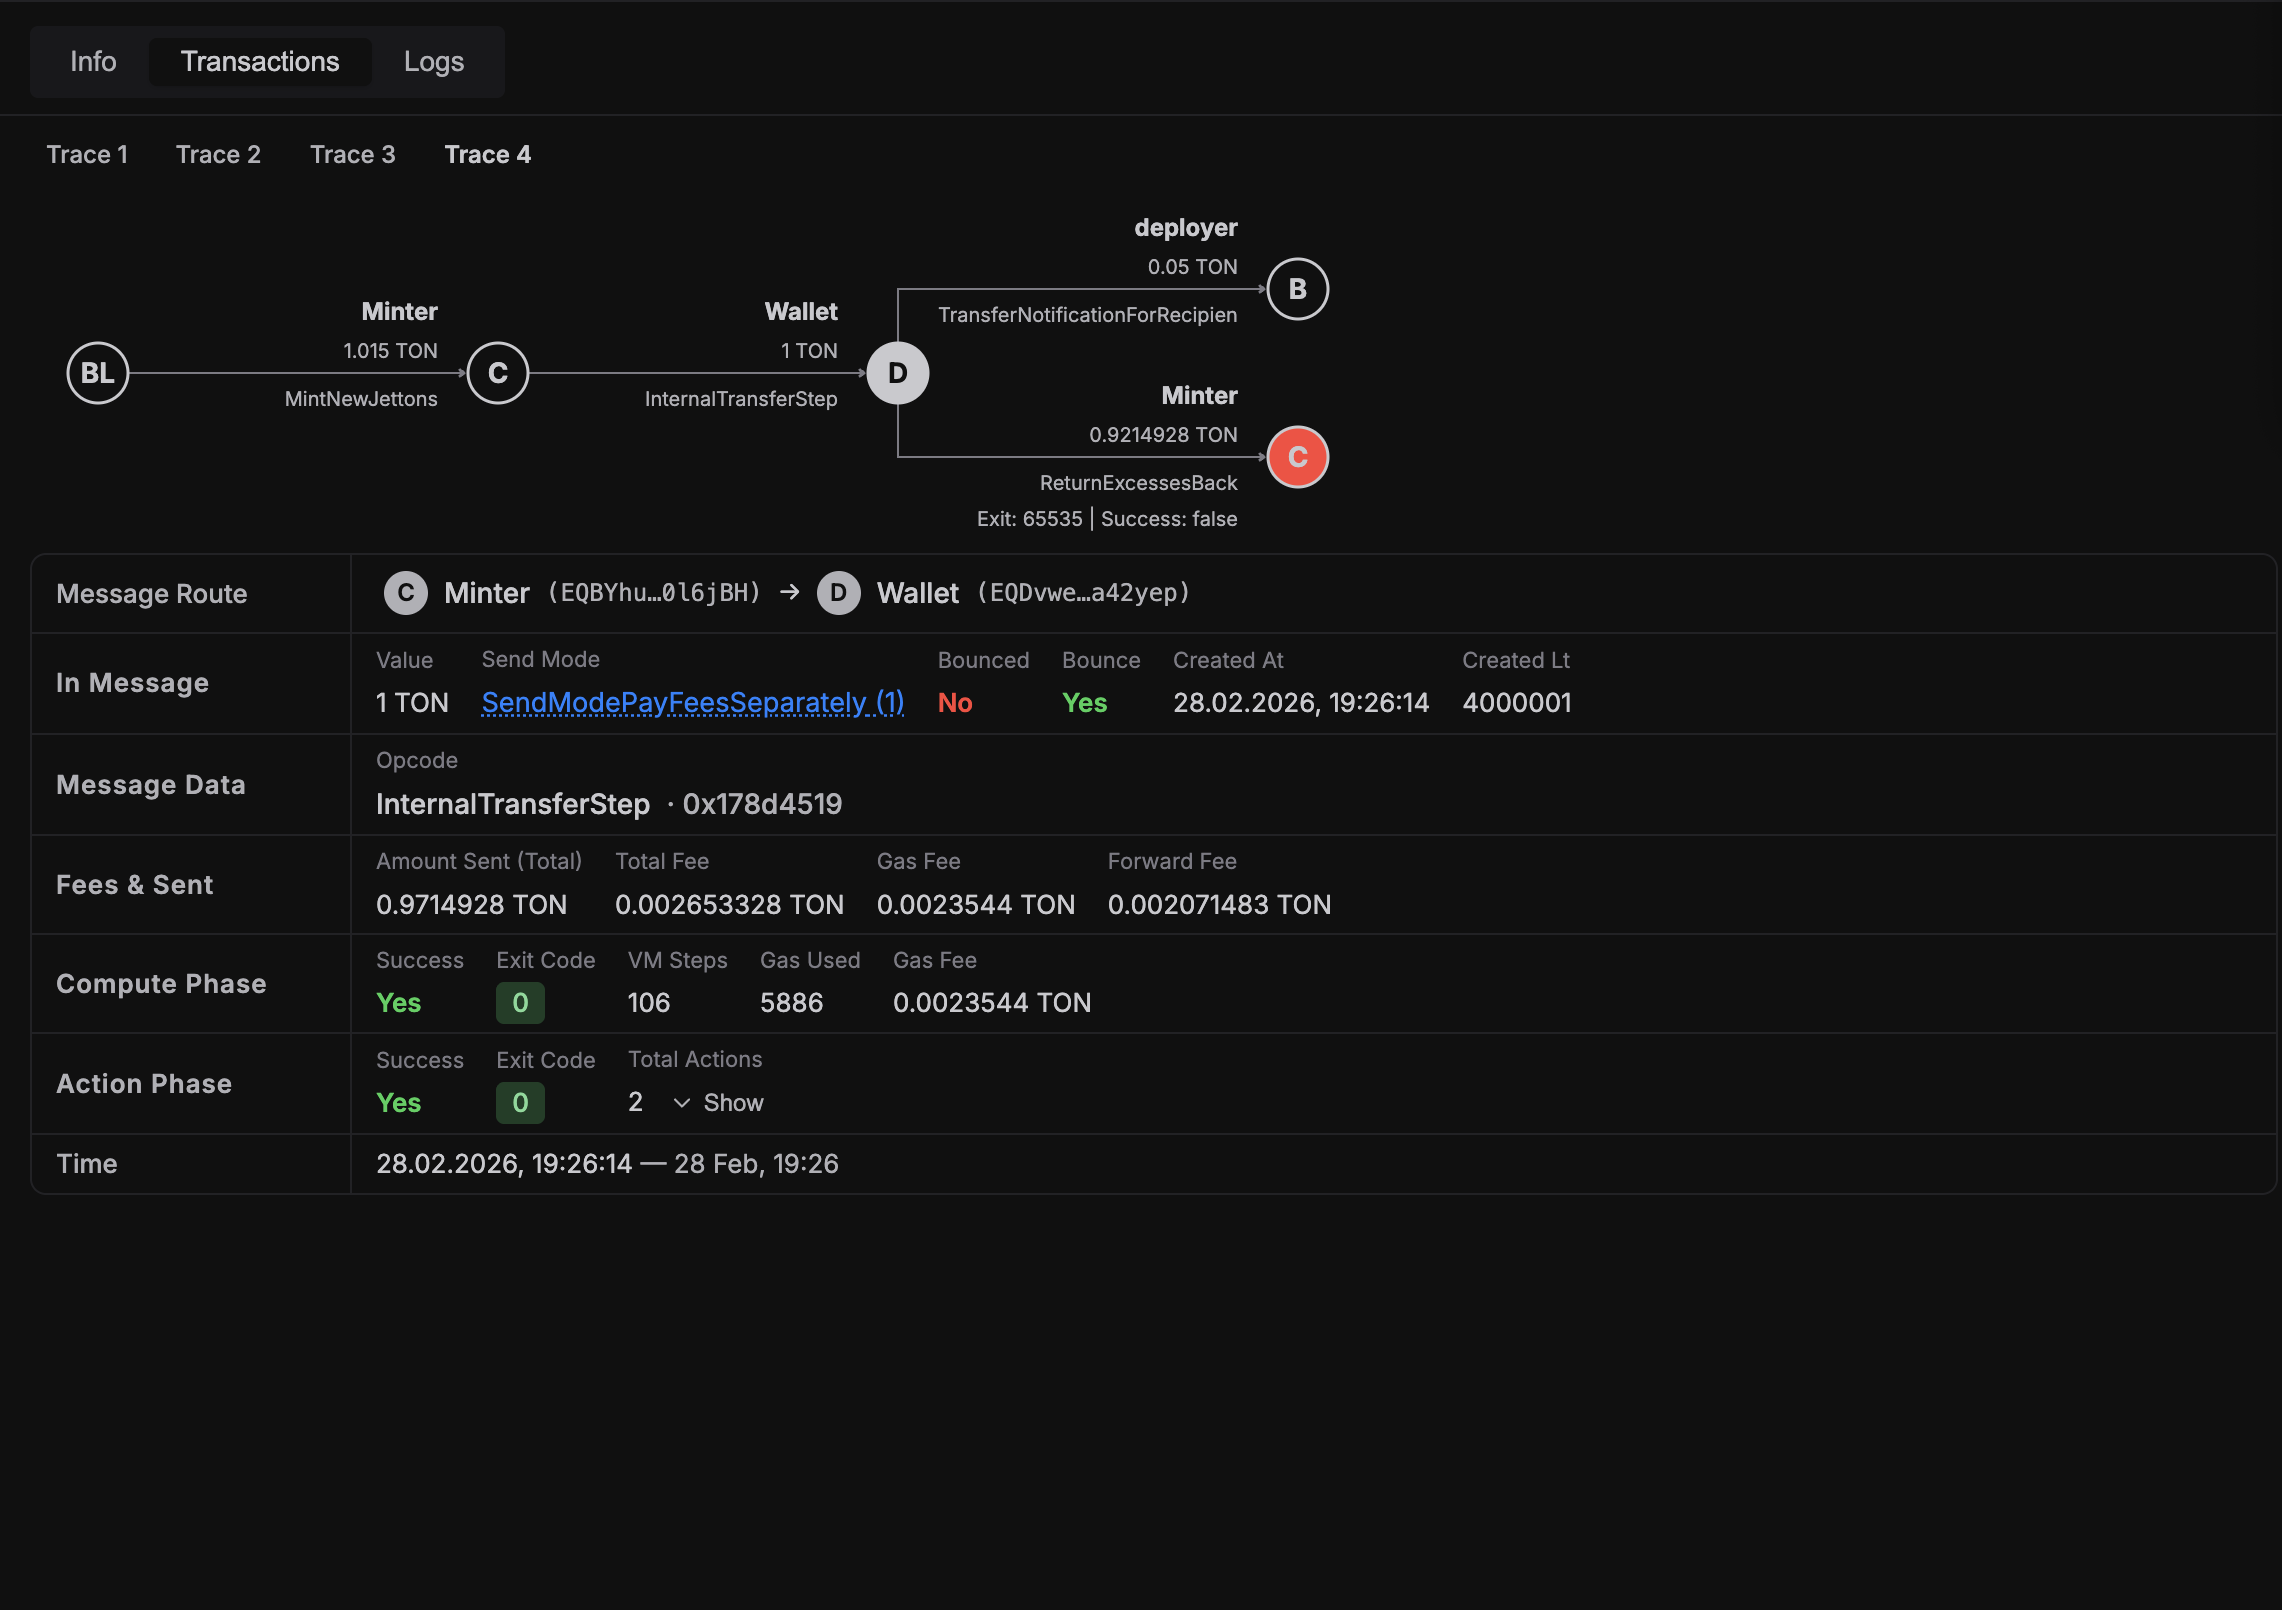
Open Transactions tab:
- select trace (if multiple)
- inspect transaction tree and failed nodes
- click node to open detailed phase/fee/exit-code panel
4. Inspect VM logs
Open Logs tab:
Executor Logfor high-level execution flowVM Logfor low-level VM details
5. Inspect gas hot paths
Open Profile tab when the run includes --gas-profile --ui:
- use the top-level
Profiletab to compare contract flamegraphs - use the per-test
Profiletab to inspect unit-test hot paths collected with--gas-profile-include-tests - click a flamegraph block to see source location, total gas, self gas, and contract share
Common issues
- UI server did not start: selected port may be busy; try
--ui-port 23456. - Coverage tab is missing: rerun tests with both
--coverageand--ui. - Profile tab is missing: rerun tests with both
--gas-profile <FILE>and--ui.
Last updated on